
We run a benchmark that we are also a contestant in. That is the first thing to know about TRACE, and we would rather say it in the opening sentence than bury it under a methodology heading. The rest of this post is about why we built it anyway, how it works, what it said on November 6, 2026, and what you can do to check whether we are kidding ourselves.
Why build a benchmark you compete in
This fall Context.dev showed up in benchmarks other people run. Scrapingbench put an agent in front of ten scraping APIs and counted finished tasks. WebCrawlerAPI, a competitor, ran 806 URLs through seven tools and published the success rates. We are grateful for both, and we link to them from our benchmarks page as published.
They share one limit, and it is not the authors' fault. They are snapshots. A run from October tells you how the APIs behaved on those pages, on that day, with those settings. Scraping does not hold still. Sites change their bot defenses, providers ship fixes, a page that failed on Tuesday loads on Thursday. We wanted a number that moved with the web, measured on pages nobody had tested before, with every record published so a reader could disagree with us using our own data.
So TRACE draws a new sample every day. No page is ever tested twice.
What happens every day at 00:15 UTC
The pipeline has four steps.
- Discover. On each source's own schedule we poll 197 public feeds, registries and sitemaps: publisher RSS feeds, job boards, SEC and Federal Register listings, documentation release APIs, community sites. Once a day we also diff the previous UTC day's non-bot edits on English Wikipedia and keep the external links that were added.
- Sample. At 00:15 UTC we draw up to 300 previously unseen pages per category, with at most 125 from any one organization and 375 from any one website. There are nine categories: news, commerce, jobs, finance, research, legal and government, software and docs, community, and the Wikipedia links as "other".
- Freeze. The sample is locked and sent to all four providers (context.dev, Exa, Firecrawl and Keenable) with caching turned off. Each request has a 27 second deadline. Keenable has no deadline setting, so our own 30 second cutoff applies there.
- Grade. A judge reads each response and decides whether it contains substantive content from the requested page. The judge never sees which provider sent the text.
The judge is TypeSafe's Jev 1.13.0 model, reading up to 12,000 characters taken from the beginning, middle and end of each response. If the evidence is unclear or the judge fails, the result stays unresolved rather than being guessed, and unresolved results count against the provider's score.
Scores are category-weighted. We compute the useful-content rate inside each category and average those rates, so a category with 300 pages has the same influence as one with 80. The ± range on each score is a 95% confidence interval. Two providers only get separate places on the leaderboard when an exact McNemar test on the pages they disagree about passes at the 95% level. Otherwise they share a place.
What the November 6 sample says
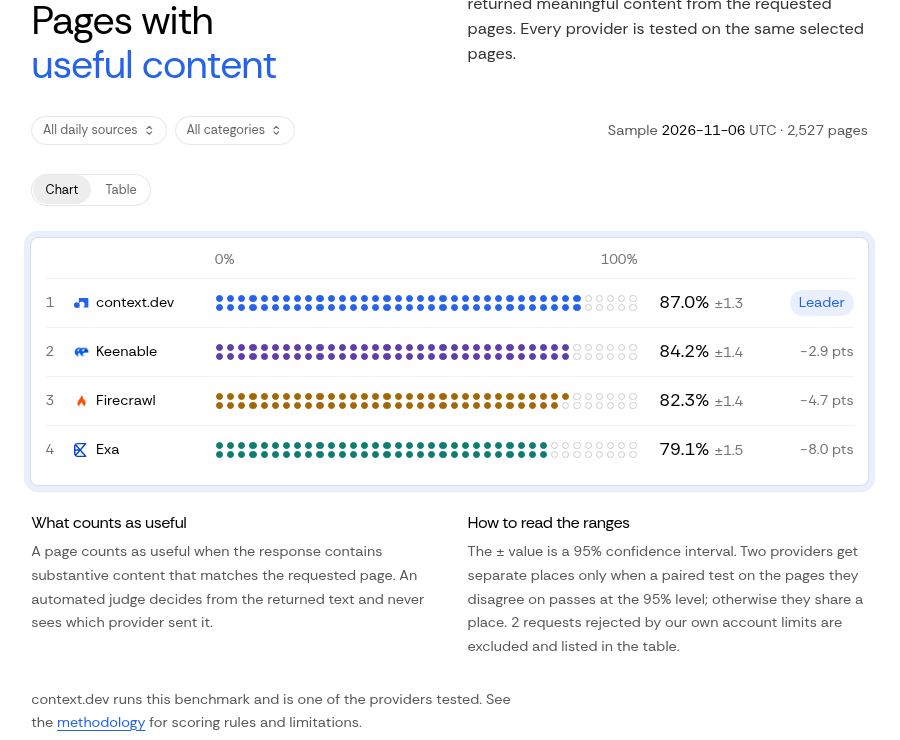
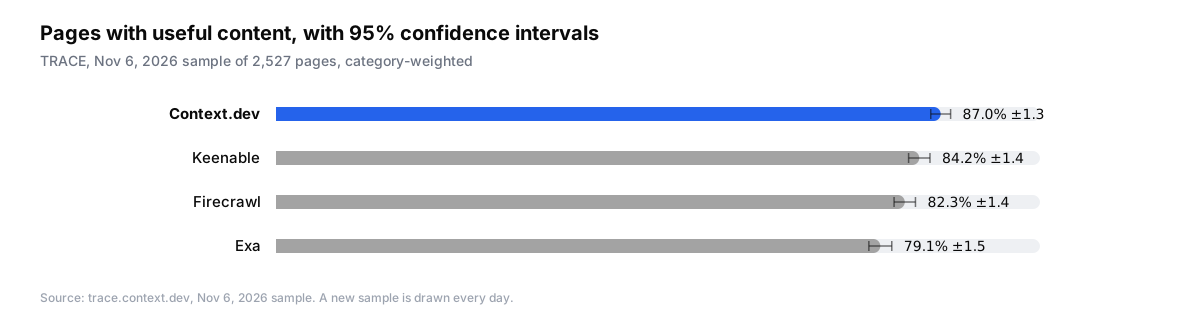
Here is the leaderboard for the Nov 6, 2026 sample of 2,527 pages. The site updates daily, so by the time you read this the live numbers will differ.
| Provider | Useful content | 95% CI | p50 | p95 | Cost per 1,000 useful pages |
|---|---|---|---|---|---|
| context.dev | 87.0% | ±1.3 | 1.75 s | 8.91 s | $0.79 |
| Keenable | 84.2% | ±1.4 | 1.27 s | 16.8 s | $4.00 |
| Firecrawl | 82.3% | ±1.4 | 1.59 s | 11.1 s | $1.20* |
| Exa | 79.1% | ±1.5 | 1.20 s | 18.1 s | $1.26* |
context.dev returned useful content from 87.0% of pages. The gap to Keenable is 2.9 points, and the paired test calls it: on the pages the two disagreed about, context.dev got 148 that Keenable missed, and Keenable got 71 that context.dev missed. Against Firecrawl the split was 160 to 35, and against Exa 285 to 73. context.dev has ranked first in all three scored samples so far: 87.7% on Nov 4, 87.1% on Nov 5, 87.0% on Nov 6.
Getting a response is not the same as getting the page. The quality section follows each provider from "returned content" through "right page" to "substantive". For context.dev, 93.6% of responses were the requested document rather than a homepage or a different item, and 86.8% held the page's main content rather than a title and navigation. The median context.dev response was 8,205 characters. Firecrawl's was 11,897, but context.dev and Firecrawl ask for main content only while Exa returns full text, so length is a signal rather than a score.
The failure chart is the same story from the other side. context.dev failed to return useful content on 13.2% of pages, Keenable on 16.2%, Firecrawl on 18.1%, Exa on 21.2%. Thin pages and wrong documents count as failures under this rule, and so do provider-reported errors and missed deadlines.
Latency and the slow tail
Time runs from sending the request to receiving the full response, measured from Vercel's US East region with caching off. On the Nov 6 sample, context.dev's median request finished in 1.75 seconds, and 95% of its requests finished within 8.91 seconds, the shortest slow tail of the four providers. Its p99 is 26.1 seconds, inside the 27 second deadline, and 0.0% of its requests hit that deadline.
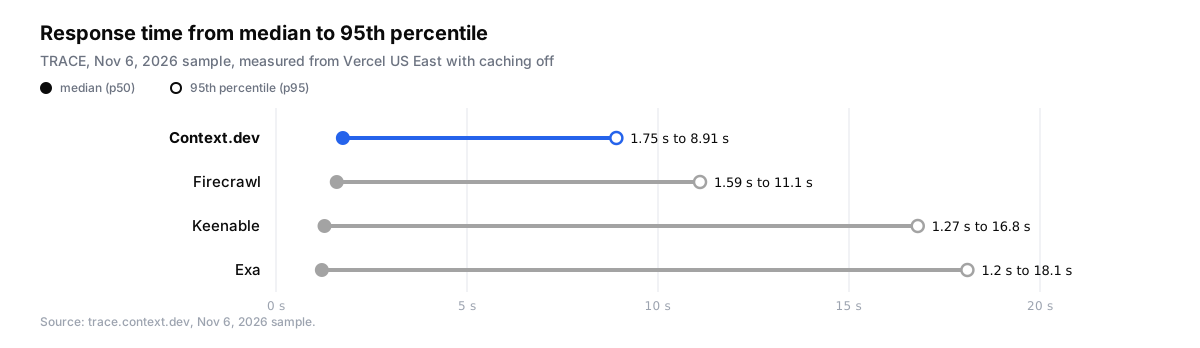
The slow tail is where the providers separate. If a batch is only done when its last page is done, p95 is the number to read, and the tail is where we spend our effort.
By category, context.dev led the overall score and led in news. Categories are weighted equally, so no single category can carry the overall number on its own.
What a useful page costs
A cheap request is not cheap if it fails. For each provider we took the published monthly price for roughly 100,000 pages (checked Nov 5, 2026), worked out the price per 1,000 requests, and divided by the useful-content rate.
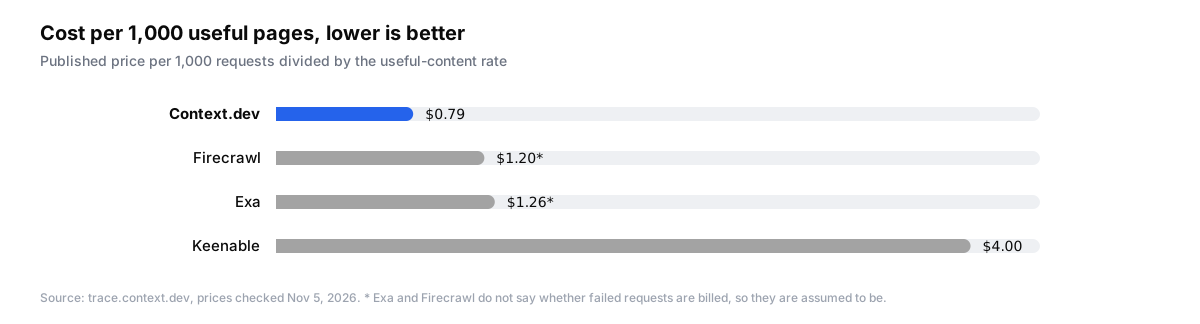
context.dev's Pro plan is $99 for 125,000 pages, so $0.79 per 1,000 requests, and because we do not bill failed requests the cost per useful page is also $0.79. Keenable says it does not bill failures either, so its $4.00 per 1,000 requests stays $4.00; its first 100,000 requests each month are free, which this table does not model. The asterisks on Firecrawl ($1.20) and Exa ($1.26) mean we could not find a statement either way about billing failed requests, so we assumed they are billed. If that assumption is wrong, their cost per useful page drops back to their list price. Volume discounts, annual billing and free tiers all change the picture.
The obvious objection
We built the harness, we chose the sources, and we are on the leaderboard. Each of those is a place where a thumb could rest on the scale. Here is what we did about it.
The code is open source under MIT, including the collector, the judge prompt and the exact request settings per provider. Any change to a provider's settings is logged in the repository with the date it took effect. The judge never sees the provider name; for the quality grades it sees the requested URL, title and category, still without the provider. Every page-level record (URL, provider, timing, HTTP status, judge verdict, and a hash of the returned text) is downloadable, and grading evidence is kept for 30 days so a sample can be regraded. When a sample is regraded under a newer rule, both grades are kept so they can be compared on identical pages; the original is never overwritten. Rankings use paired tests, so nobody climbs on noise.
The benchmark has limits, and the site lists them. The judge can make mistakes, and no human audit has been published yet for the current scoring rule; weekly hand checks are planned, with agreement published once the first audit is in. 248 provider results in the current selection are unresolved and count against the score of whoever they belong to. Latency comes from one region with caching off. The sample is drawn from sources we chose rather than a random sample of the web. And 223 pages defeated every provider, most of them from legal and government sources, job postings, and the Wikipedia links.
Check our work
Everything on the site comes from records you can pull yourself. The daily summaries with intervals are at /api/report:
curl -s https://trace.context.dev/api/report \
  | jq '.latest.providers[] | {id, rate, ci, p50, p95}'
Every page-level record for a given day is downloadable as NDJSON from the site, the methodology section spells out each rule that touches a score, and there is a plain-text summary at llms.txt for anyone reading through an assistant. The collector, judge prompts and request settings live in the trace-benchmark repository.
If you use TRACE in your own work, cite it as Bakour, Yahia and Ryaboy, Michael, "TRACE: A Live Open-Source Scrape Benchmark for AI Agents", 2026, with the repository URL. The BibTeX entry is on the site under Citation.
The method owes a debt to NEEDLE, the live search benchmark from Keenable's Andrey Styskin, Matthias Petri and Ilya Gusev. Their idea of fresh queries nobody has indexed, compared in the open, is what we borrowed and applied to scraping rather than search. It is a slightly odd thing to say about a company we rank against, but it is true.
TRACE is one input. We also appear in benchmarks we do not run, and the benchmarks page lists them with their dates. If you want to know what the Scrape API does on your URLs, the honest answer is to run them. The docs show how, and the free tier covers a sample.
FAQs
Which web scraping API had the highest success rate on TRACE?
In the Nov 6, 2026 sample, context.dev returned useful content from 87.0% of 2,527 pages, followed by Keenable at 84.2%, Firecrawl at 82.3% and Exa at 79.1%. The lead over Keenable is statistically significant under the paired test.
Does TRACE use cached pages?
No. Every request asks for a fresh fetch, and each response is checked for the provider's own cache marker. Responses served from cache are left out of the scores and the latency figures.
Can I reproduce the TRACE results?
Yes. The collector, judge prompt and request settings are open source under MIT, and every page-level record for each day can be downloaded from trace.context.dev.