
API update
This article includes examples from before the API consolidation. Use these current endpoints for new integrations; the older examples below are retained for reference.
| Earlier API | Current API |
|---|---|
| Extract and Product APIs | Answers: POST /v1/web/answers. For research, send task and an optional json_format example object, not JSON Schema. Read json_content and sources. Fast mode costs 10 credits; Ultra is the 100-credit default. For known page fields, use Scrape with formats.parse and CSS rules in parseParams.rules. |
See the current API catalog, pricing, and OpenAPI specification for current parameters, responses, and costs.
Every failure mode you learn as an engineer comes with a signal. A stack trace, a non-200, a timeout, a failed assertion. You learn to read the signal and work backward from it, and after a few years the whole discipline feels like pattern matching against things that announced themselves.
Agents that read the web break that habit, because the interesting failures don't announce anything. The fetch succeeds. The schema validates. The model returns confident, well-formed, plausible output. And the answer is useless in a way that no status code will ever tell you about.
This guide builds a real one, breaks it, and debugs it. We'll use Context.dev's Extract API to read release notes and pull structured data out of them, and Respan to trace what actually happened inside the run. Everything below is from an actual execution against the Node.js 24.0.0 release notes, including the part where it went wrong.
What you're building: a changelog watcher that flags breaking changes
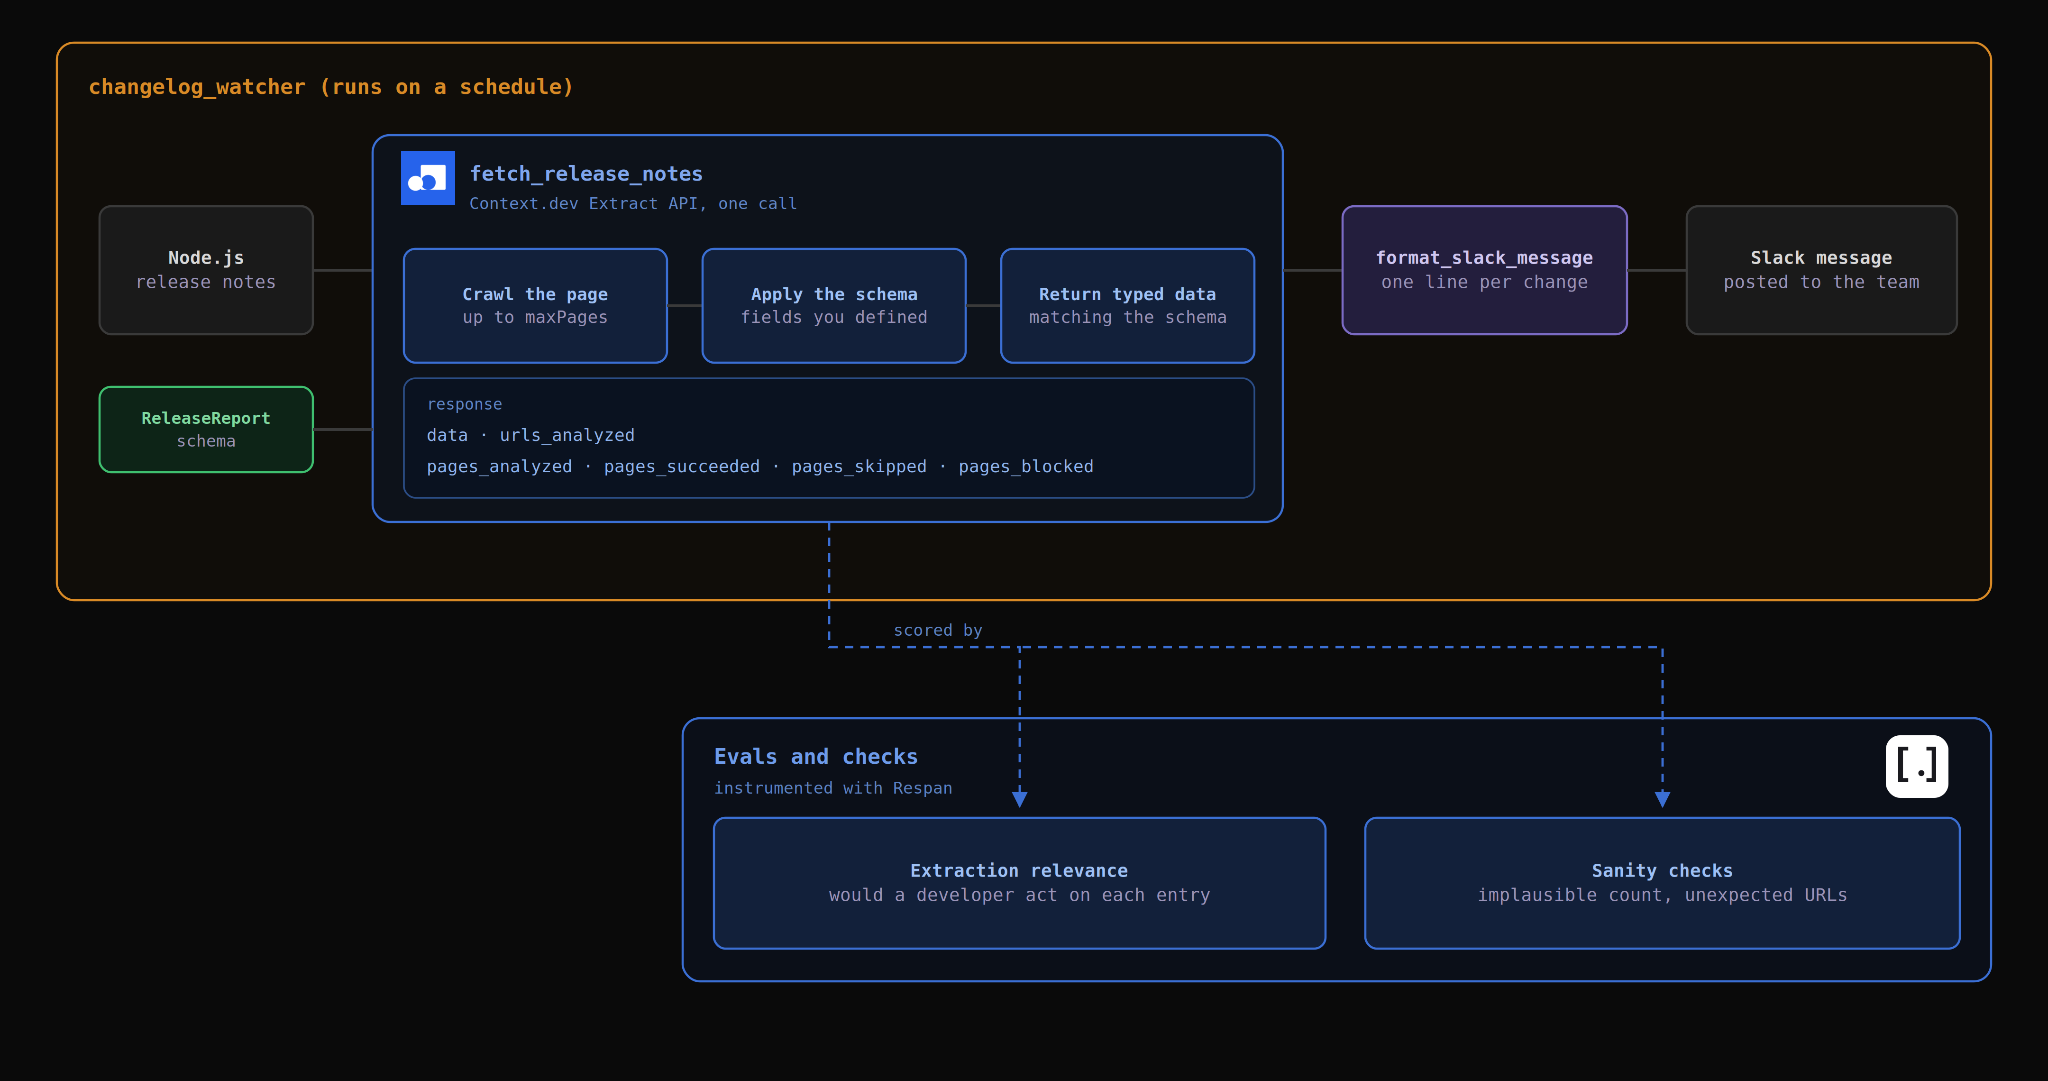
Upgrades break things, and the warning was almost always in the changelog. Nobody read it, because release notes for a major version are hundreds of lines of commit messages and the three that matter are not marked out from the ninety-three that don't.
So you build a watcher. It reads a release notes page, extracts the breaking changes into structured data, and posts a summary to Slack before anyone runs the upgrade. Small, useful, and the kind of thing a team actually adopts.
Two pieces make it work. Context.dev's Extract API takes a URL and a JSON Schema, crawls the page, and returns typed data matching your schema, which means you skip the entire scrape-then-parse-then-prompt pipeline. Respan wraps the run in a trace, so every step records its input and output and you can go back and look at what happened rather than guessing.
Without the second piece, a wrong answer is a dead end. You have the output and the input, and nothing in between to explain how one became the other.
Building the changelog watcher with Context.dev
Step 1: Define the schema you want back
Context.dev is a web context API for teams building software and AI agents. Point it at a URL and it handles the crawling, rendering, and parsing, returning clean markdown or structured data matching a schema you define. It ships SDKs for TypeScript, Python, Ruby, Go, and PHP, plus an MCP server.
The Extract API is the structured half of that, and it's what this agent needs. Most scraping work ends with markdown and a parsing problem. Extract skips it: you hand it a URL and a JSON Schema, and it returns data already shaped the way you asked for it. No HTML selectors, no regex, no prompt wrapped around a wall of text. It costs 10 credits a call against 1 for a plain scrape, and for anything where you want fields rather than prose it's worth the difference.
It's schema-first, which means the schema does most of the work. You describe the shape of the answer, and the descriptions you attach to each field are what tell the model what to look for. Pydantic generates the JSON Schema for you, so the schema and your runtime types stay the same object:
from pydantic import BaseModel, Field

class BreakingChange(BaseModel):
    component: str = Field(description="The subsystem, e.g. 'fs', 'tls', 'http'.")
    description: str = Field(description="What changed, in one sentence.")

class ReleaseReport(BaseModel):
    version: str = Field(description="The released version, e.g. '24.0.0'.")
    breaking_changes: list[BreakingChange] = Field(
        description=(
            "Every breaking change in this release. Node.js marks these with "
            "SEMVER-MAJOR in the commit list. Return an empty list only if the "
            "release genuinely contains none."
        )
    )
Those description strings are doing more work than the field names are. breaking_changes on its own tells the model nothing; the description is where you say what counts. And nothing in this one defines what a breaking change actually is. It gestures at Node's SEMVER-MAJOR convention and leaves the rest to the model.
Step 2: Extract against it with the Extract API
One call, with the schema and a plain-language instruction:
import os
from context.dev import ContextDev

context = ContextDev(api_key=os.environ["CONTEXT_DEV_API_KEY"])

response = context.web.extract(
    url="https://nodejs.org/en/blog/release/v24.0.0",
    schema=ReleaseReport.model_json_schema(),
    instructions=(
        "Read the release notes page. Collect every commit marked "
        "SEMVER-MAJOR as a breaking change."
    ),
)
report = ReleaseReport.model_validate(response.data)
That's the whole fetch layer. No scraper, no HTML parsing, no prompt engineering around a wall of markdown. The call costs 10 credits and returns in a couple of seconds once the page is warm.
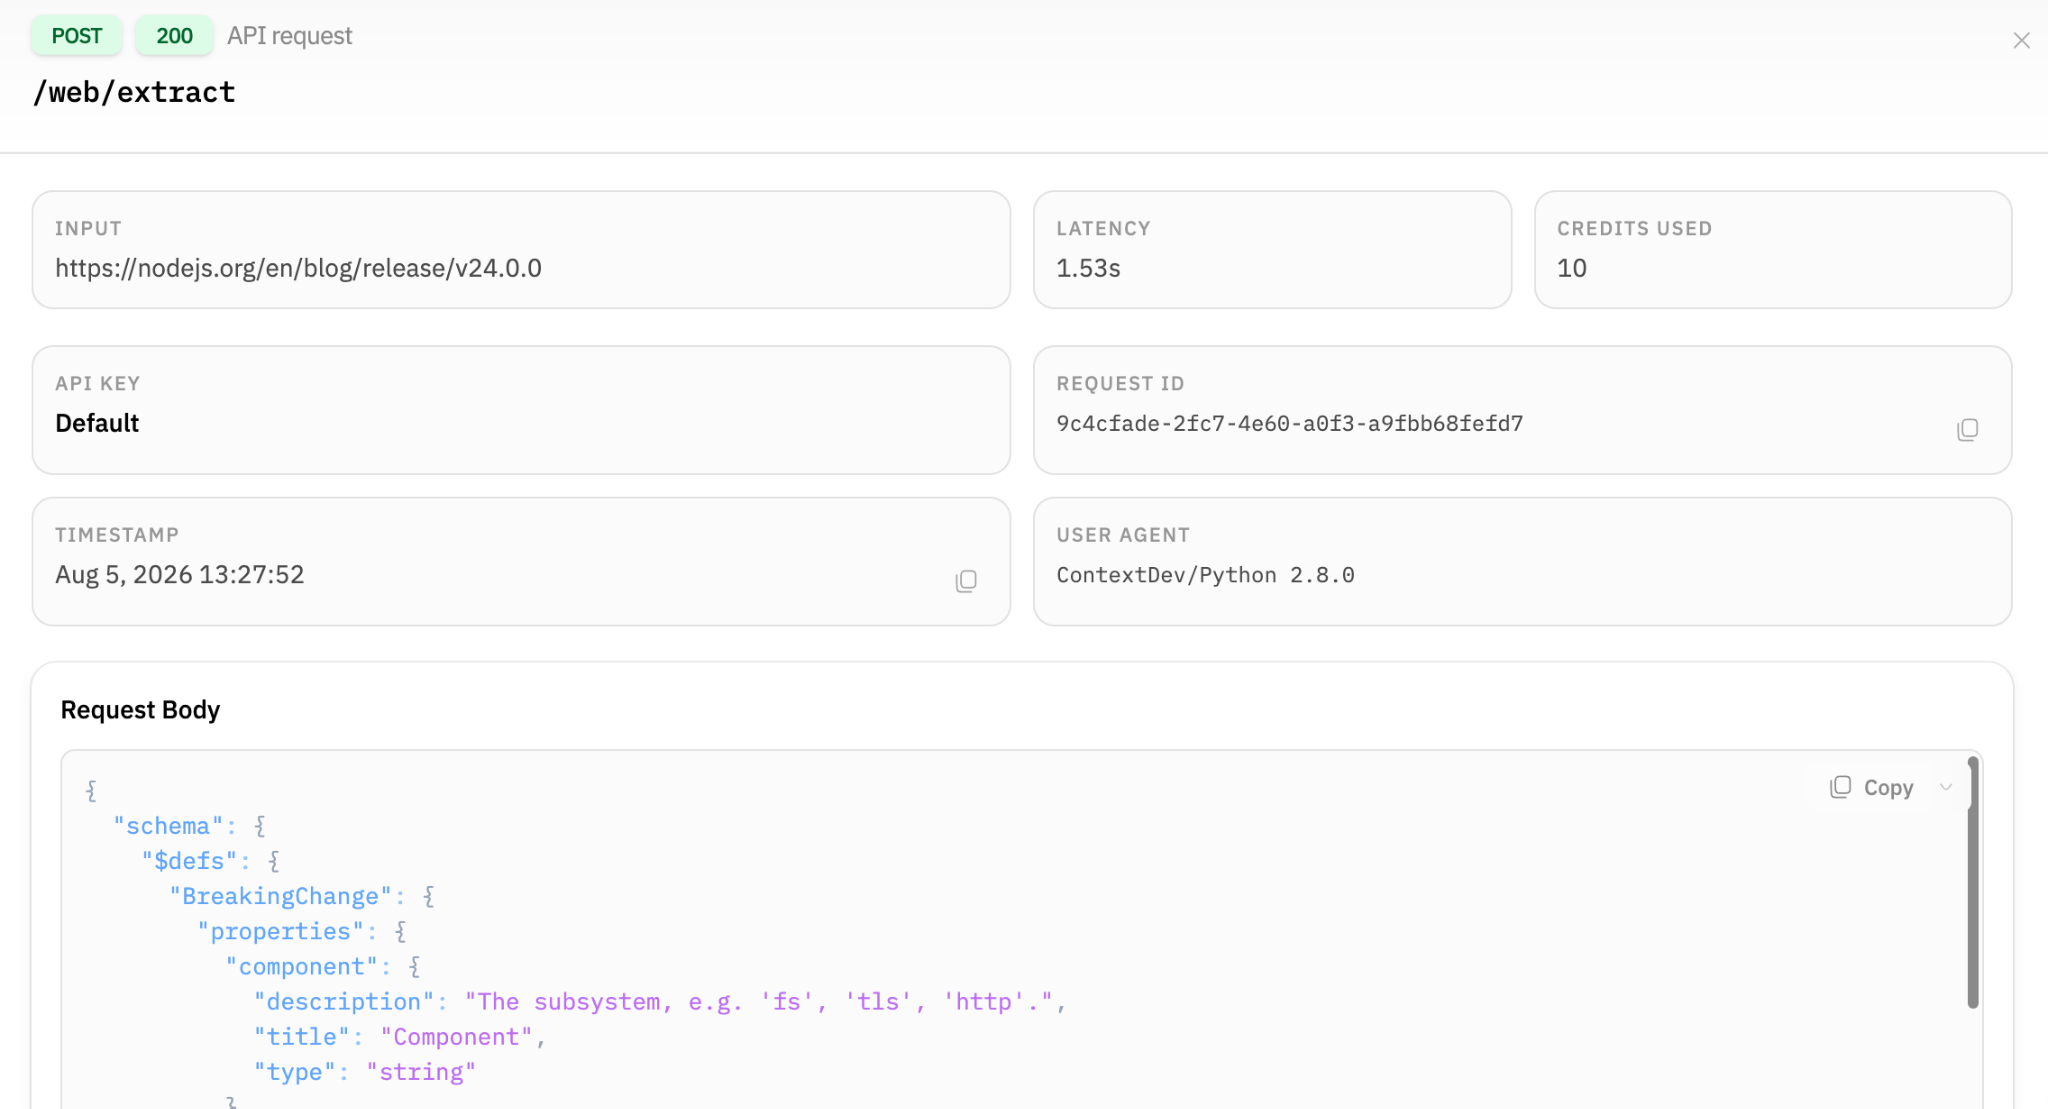
The response carries more than data, and the extra fields are the ones this article is about:
urls_analyzed- Every URL the crawler actually used to produce the answer.metadata.numUrls- How many URLs it attempted.metadata.numSucceeded- How many it fetched and analyzed.metadata.numSkipped- How many it evaluated and discarded as irrelevant.metadata.numBlocked- How many were CAPTCHA walls, 403s, 404s, or parked domains.
Nobody reads those on a run that works. That's fine, and it's why the failure below is hard to catch.
Step 3: Post the summary to Slack
Format the structured data into a message and send it:
def format_slack_message(report: dict) -> str:
    version = report.get("version", "unknown")
    changes = report.get("breaking_changes", [])
    if not changes:
        return f"*Node.js {version}*\nNo breaking changes in this release."
    lines = [f"*Node.js {version}*", f"{len(changes)} breaking changes:"]
    for change in changes[:10]:
        lines.append(f"  - `{change['component']}` {change['description']}")
    if len(changes) > 10:
        lines.append(f"  ...and {len(changes) - 10} more")
    return "\n".join(lines)
Point it at a Slack webhook, put it on a schedule, and you're done. It works on the first try, which is the problem.
What a useless answer looks like
Here's what it posted for Node.js 24.0.0:
Node.js 24.0.0
96 breaking changes:
  - src enable Float16Array on global object
  - src enable explicit resource management
  - src,test unregister the isolate after disposal and before freeing
  - src use non-deprecated WriteUtf8V2() method
  - src use non-deprecated Utf8LengthV2() method
  - src use V8-owned CppHeap
  - test fix test-fs-write for V8 13.6
  - build update list of installed cppgc headers
  - tools update V8 gypfiles for 13.6
  - tools update V8 gypfiles for 13.5
  ...and 86 more
Read the entries. update V8 gypfiles for 13.6 is a build system change. fix test-fs-write is a test fix. update list of installed cppgc headers is internal plumbing. None of these will break anyone's application code, and none of them belong in a message whose entire job is telling a team whether it's safe to upgrade.
Node.js 24 does contain real breaking changes. tls.createSecurePair was removed. fs.truncate lost the ability to take a file descriptor. OutgoingMessage._headers is gone. Those are in there somewhere, inside the 86 the message didn't show, ranked no differently from a gypfile update.
Now the part that makes this a debugging problem rather than a bug report. Nothing failed:
- The extraction returned HTTP 200. So did all six calls, at 10 credits each.
- The response validated cleanly against the Pydantic schema.
- Every required field was populated.
- No retries, no timeouts, no exceptions.
numFailed: 0andnumBlocked: 0. Every page the crawler tried, it got.
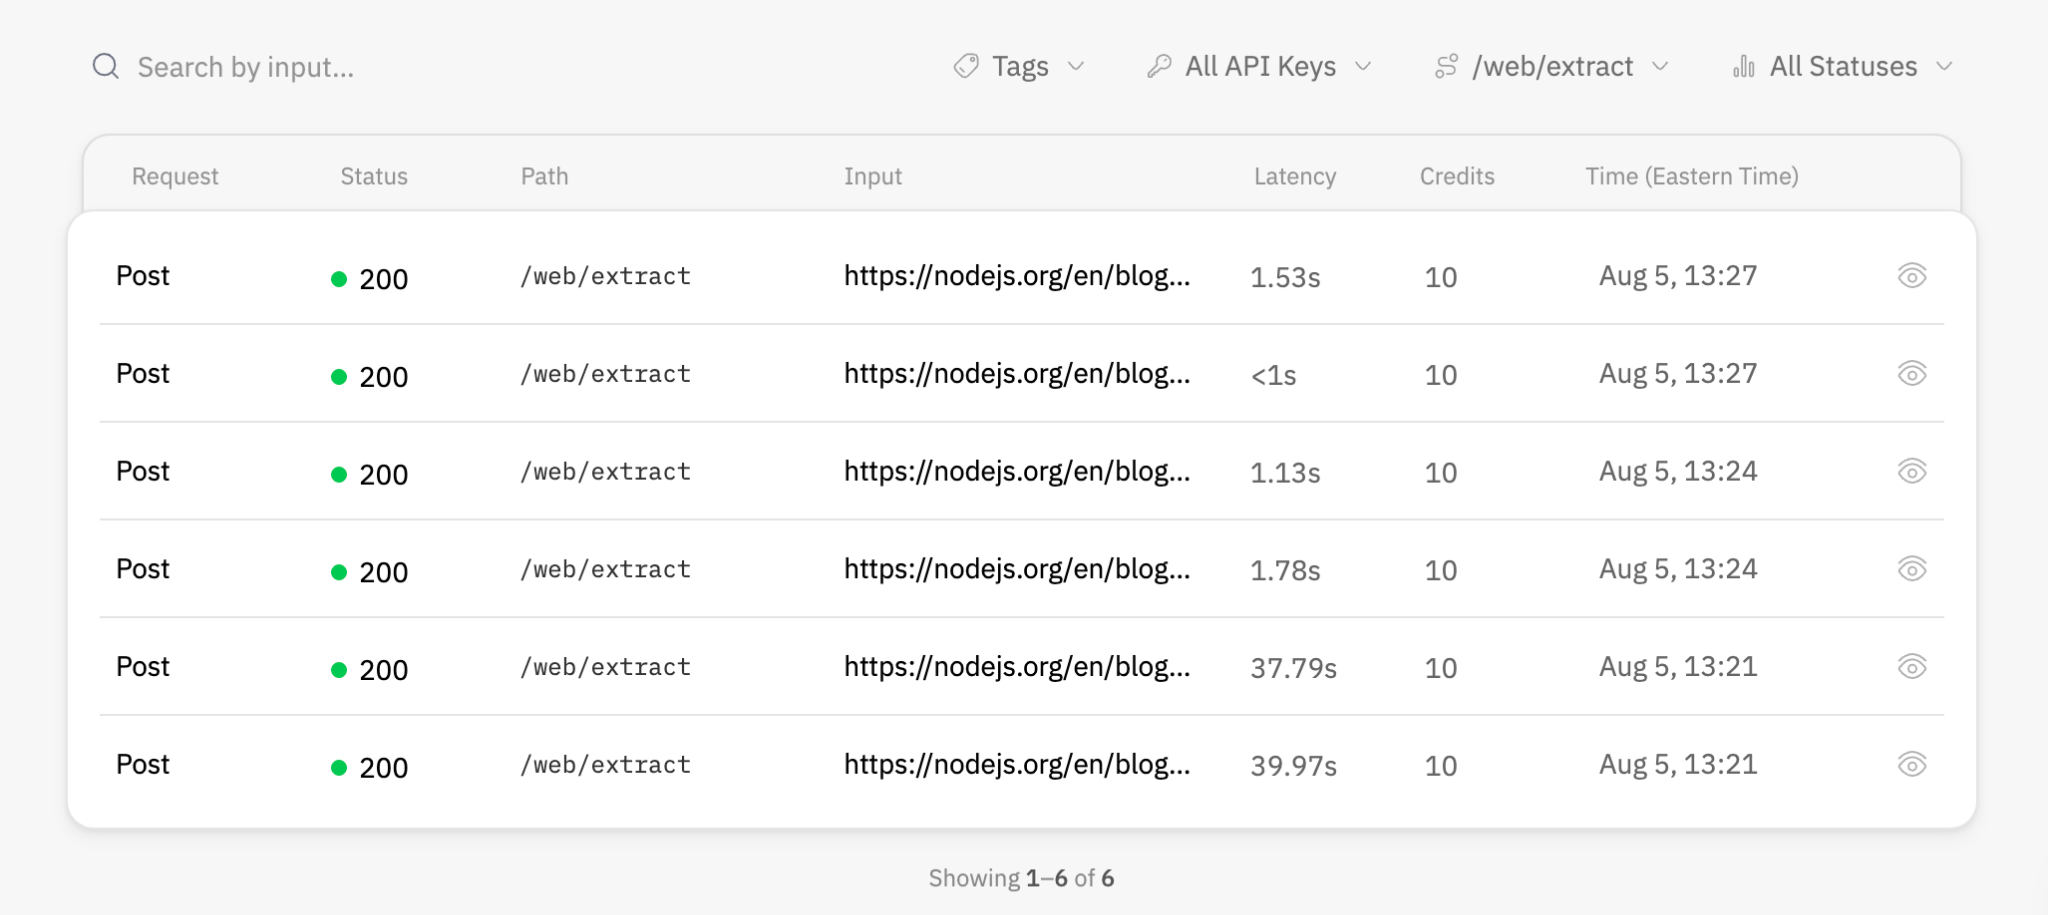
A dashboard watching this agent shows green. An on-call alert never fires. The only signal that anything is wrong is a human reading the Slack message and finding it useless, and humans stop reading a channel that posts 96 items a week.
Debugging it with Respan
You can't debug this from the Slack message, because the message is the last step and it faithfully rendered what it was given. You need what happened before it.
Step 1: Trace the extraction as part of the run
Respan builds everything on spans, and its decorators group them into one tree per run. Initialize Respan once, then decorate the functions you want to see:
from respan import Respan
from respan.decorators import workflow, task

Respan()

@task(name="fetch_release_notes")
def fetch_release_notes(url: str, fact_check: bool = False):
    kwargs = {
        "url": url,
        "schema": ReleaseReport.model_json_schema(),
        "instructions": (
            "Read the release notes page. Collect every commit marked "
            "SEMVER-MAJOR as a breaking change."
        ),
    }
    if fact_check:
        kwargs["fact_check"] = True
    response = context.web.extract(**kwargs)
    meta = getattr(response, "metadata", None)
    return {
        "data": response.data,
        "urls_analyzed": list(getattr(response, "urls_analyzed", []) or []),
        "pages_analyzed": getattr(meta, "numUrls", None),
        "pages_succeeded": getattr(meta, "numSucceeded", None),
        "pages_skipped": getattr(meta, "numSkipped", None),
        "pages_blocked": getattr(meta, "numBlocked", None),
    }

@task(name="format_slack_message")
def format_slack_message(report: dict) -> str:
    ...

@workflow(name="changelog_watcher")
def changelog_watcher(url: str, fact_check: bool = False) -> str:
    result = fetch_release_notes(url, fact_check=fact_check)
    report = ReleaseReport.model_validate(result["data"])
    return format_slack_message(report.model_dump())
One detail worth copying rather than skipping: fetch_release_notes returns a plain dict rather than the SDK's response object. Return the response object and the span records nothing, because the tracer can't serialize it, and you end up debugging with an empty Output panel. Pull the fields you care about into a dict on the way out.
Step 2: Read the data the extraction returned
Within Respan, you can open the changelog_watcher trace and expand fetch_release_notes. Its output is the full extraction: the version, the 96-entry array, and the crawl statistics.
The first thing to look at is not the entries. It's the count. 96 breaking changes in one release is not impossible, but it's implausible enough that it should have been the first thing anyone questioned, and it wasn't, because nothing in the pipeline was set up to have an opinion about plausibility.
As Respan is an observability tool, it gives you insight into exactly what happened, when, and what prompted it.
Step 3: Check which pages it actually read
This is where the run stops being a mystery. urls_analyzed on that span:
[
  "https://nodejs.org/en/blog/release/v24.0.0",
  "https://nodejs.org/blog/release/v26.7.0",
  "https://nodejs.org/en/blog/release/v22.15.0",
  "https://nodejs.org/en/blog/release/v24.0.1",
  "https://nodejs.org/dist/v24.0.0"
]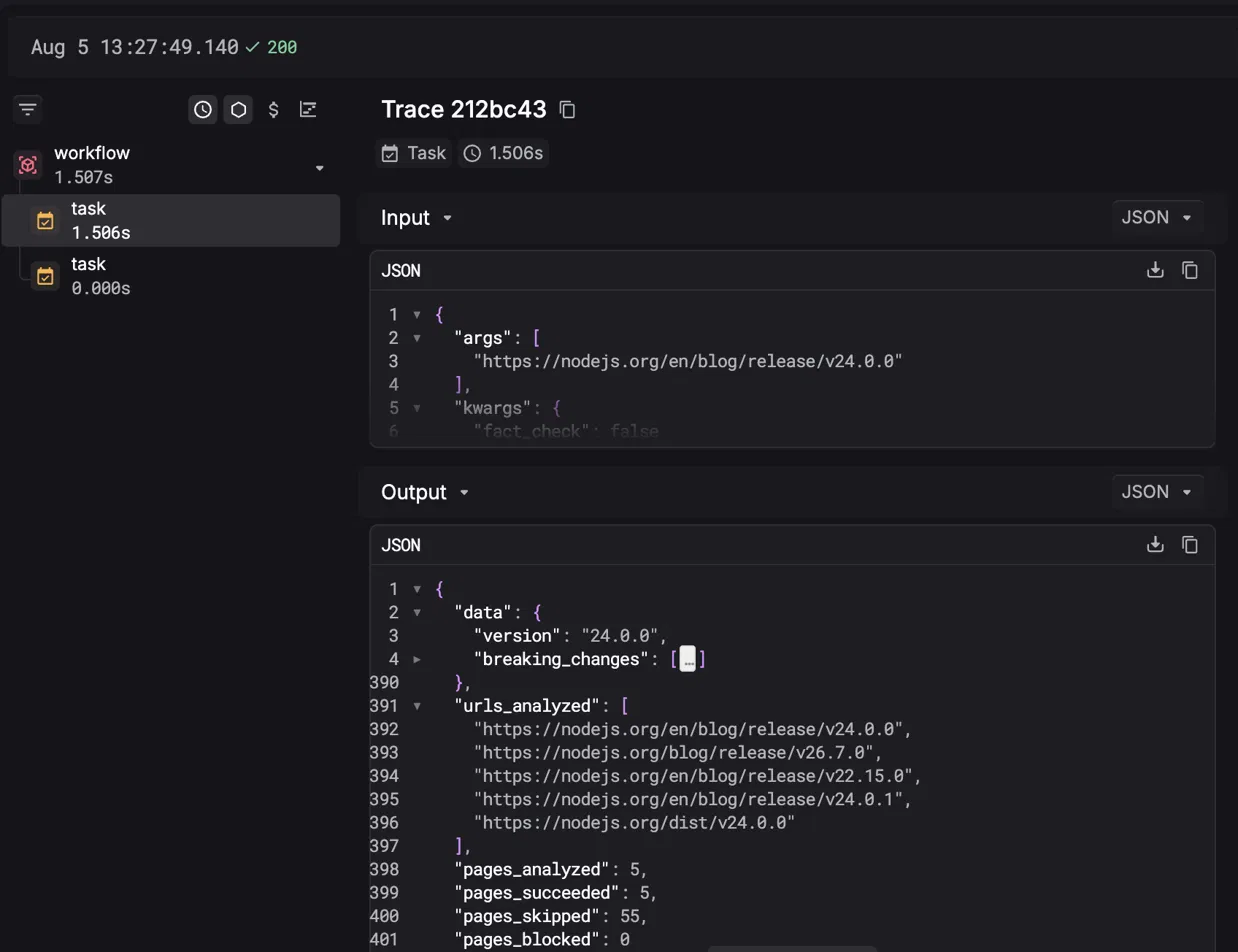
You asked about v24.0.0. The crawl read v26.7.0, v22.15.0, and v24.0.1 as well, then merged everything it found into one report labelled 24.0.0. Three of the five pages that produced this answer are about different releases.
The crawl statistics on the same span fill in the rest:
pages_analyzed: 5
pages_succeeded: 5
pages_skipped: 55
pages_blocked: 0
55 skipped is the interesting number. The crawler evaluated sixty pages, decided fifty-five were irrelevant to the schema, and kept five. The relevance filtering worked exactly as designed, and on most jobs that discovery is the reason to use a crawler rather than a page reader. It just meant five pages about Node releases all looked equally relevant to a schema about Node releases, and there was no signal anywhere that "wrong ones" was a possibility.
Step 4: Compare the schema you wrote to the answer you got
The last check is the one that isn't in any tool. Put your schema next to the output and ask whether the output is a correct answer to the question the schema asked.
The schema asked for breaking_changes, described as "every breaking change in this release," with a hint that Node marks them SEMVER-MAJOR. The output is every commit tagged SEMVER-MAJOR across four releases. That is, precisely and literally, what was requested. The extraction did not misunderstand anything.
What made the extraction over-report
Three causes. The first widened what got read, and the other two decided what came back, which is why fixing only the first would still have produced a bad answer.
maxPages defaults to 5, and the crawl follows links
The Extract API is a crawler, not a page reader. It starts at your URL and follows internal links looking for pages relevant to your schema, up to maxPages, which defaults to 5 and accepts a value from 1 to 50.
For lead enrichment, that default is exactly right. You point it at a company homepage and want it to find the about page and the careers page on its own. For a changelog watcher, it's wrong in a specific way, because a release notes page links to every other release notes page, and every one of them is highly relevant to a schema about releases. The crawler did what it was designed to do and the design didn't match the job.
SEMVER-MAJOR does not mean "will break your code"
Node.js tags a commit SEMVER-MAJOR when it can't ship in a minor release. That includes API removals, and it also includes V8 engine upgrades, build system changes, and test infrastructure that depends on them. It's a release engineering marker, not a compatibility warning.
The instruction told the model to treat SEMVER-MAJOR as the definition of a breaking change. It complied. The marker was never the right proxy.
A field named breaking_changes doesn't define breaking_changes
The schema said "every breaking change in this release" and left the rest to inference. Nothing in it says what a breaking change is from the perspective of someone deciding whether to upgrade: a public API that no longer exists, a signature that changed, a default that moved.
A field name is not a specification. When you hand a model a schema, the descriptions are the specification, and vague descriptions produce output that's technically responsive and practically useless.
How to catch the next one automatically
Step 1: Constrain the crawl to the page you meant
Set maxPages to 1. You know which page you want; there's no discovery to do:
response = context.web.extract(
    url="https://nodejs.org/en/blog/release/v24.0.0",
    schema=ReleaseReport.model_json_schema(),
    max_pages=1,
    fact_check=True,
    instructions=(
        "Read only this release notes page. A breaking change is a removed or "
        "renamed public API, a changed function signature, or a changed default "
        "that requires application code to be updated. Exclude V8 engine "
        "upgrades, build system changes, test infrastructure, and internal "
        "refactors, even when they are tagged SEMVER-MAJOR."
    ),
)
Two other changes in there. The instruction now defines what a breaking change is and names what to exclude, which is the fix for causes two and three. And fact_check=True forbids the model from inferring values that aren't stated on the page. In our runs, turning it on changed the descriptions from paraphrase to verbatim text carrying the author name and PR number, which makes every entry checkable against the source.
Then verify the constraint held rather than assuming it:
assert response.urls_analyzed == ["https://nodejs.org/en/blog/release/v24.0.0"]Step 2: Score the extraction against what a developer would act on
Respan's online evals, which live under Evals then Automations, run an evaluator against live production spans, sample them, and write the score back onto the span. Point one at your fetch_release_notes span with a rubric that encodes the judgment the schema couldn't:
Here is a release report extracted from a changelog:
{{output}}

For each entry, decide whether a developer upgrading to this version would
need to change application code because of it.

Removed or renamed public APIs, changed signatures, and changed defaults
count. Engine upgrades, build tooling, test changes, and internal refactors
do not, even when the project tags them as major.

Return the proportion of entries that would require a code change, and list
any entry you excluded with a one-line reason.
A score near 1.0 means the extraction is returning things worth acting on. Our run would have scored close to zero, and it would have scored close to zero on day one, before anyone had a chance to stop reading the channel.
Step 3: Alert when a run returns an implausible count
A model can be wrong in ways a rubric misses. A count cannot be 96 without something being wrong, and that check costs nothing:
def sanity_check(result: dict) -> list[str]:
    warnings = []
    changes = result["data"].get("breaking_changes", [])
    if len(changes) > 20:
        warnings.append(f"{len(changes)} breaking changes is implausibly high")
    if len(result["urls_analyzed"]) > 1:
        warnings.append(f"crawl read {len(result['urls_analyzed'])} pages, expected 1")
    if result["pages_blocked"]:
        warnings.append(f"{result['pages_blocked']} pages were blocked")
    return warnings
Return those from the traced task and they land on the span alongside everything else the run recorded, so a failed sanity check is visible next to the output that triggered it rather than buried in application logs.
The complementary move is on the fetch side. A Context.dev monitor watching the release notes page on a schedule will tell you when the page itself changes, independently of your agent's opinion about it. Page monitors accept plain-language instructions, so you can tell it to report new breaking changes and removals while ignoring download counts and timestamps, and it judges each diff against that goal rather than firing on every cosmetic edit.
Subscribing to run.completed as well as change.detected is worth doing here. It fires after every run including the ones that found nothing, which gives you a heartbeat proving the watcher is alive. An agent that silently stopped running looks identical to a quiet week.
A debugging checklist for agents that read the web
When an agent that reads the web gives you a bad answer and nothing errored, work through these in order.
- Check the count before the content. Implausible volume is the cheapest signal you have and it takes one glance.
- Read which URLs the fetch actually used. Not the URL you passed, the list of pages the answer was built from. On the Extract API that's
urls_analyzed. - Read the crawl statistics. Skipped, failed, and blocked counts tell you whether the crawler saw what you think it saw.
- Compare the output to the schema, not to your intent. Most of the time the output is a correct answer to the question you actually asked.
- Read your field descriptions as a stranger would. If a description doesn't define its term, the model supplied a definition and you don't know what it was.
- Check the defaults on every parameter you didn't set.
maxPages, cache age, and inference behavior all have sensible defaults for the common case, and yours may not be the common case. - Ask whether the source's own labels mean what you assumed. SEMVER-MAJOR, "deprecated", and "breaking" are project-specific conventions, not standards.
None of this is reachable from a status code, and all of it is reachable from a trace. The instrumentation is one initialization line, two decorators, and a dict, and it's the difference between knowing what your agent did and guessing.
Get a Context.dev API key to build the fetch layer, and try Respan for free to see what your agent actually did.