Analytics in advertising is just using data to figure out what's working and what isn't in your ad campaigns. That's it. It's what moves marketing from "I think this campaign did well" to "this campaign produced X dollars for every Y we spent, and here's why."
Why analytics in advertising matters
Running ads without analytics is like cooking without tasting the food. You can follow the recipe, but you'll never know whether the salt was right, whether the timing worked, or why the dish came out different this time. Every batch is a guess.
With analytics, the cooking gets systematic. You know which ingredients worked. You know which ones didn't. Next time, you adjust.
From guessing to learning
Analytics gives you a feedback loop. Without it, you spend money, wait, and hope. With it, you spend money, measure, and adjust. The difference compounds fast.
Specifically, a working analytics setup lets you:
- See what people actually respond to. Which copy, which visuals, which platforms.
- Move budget where it works. Away from underperforming ads, toward the ones with real return.
- Defend the spend. When someone asks "why are we spending $50k on LinkedIn," you have an answer that isn't "gut feel."
The market is moving in this direction hard. Ad analytics is projected to grow from $6.04 billion in 2025 to $20.33 billion by 2035 — you can read the full market analysis here.
The shift is subtle but important: you stop asking "did my ads work?" and start asking "how do I make them work better?"
That question, repeated, is what separates teams that scale campaigns from teams that launch and hope. The rest of this guide is about how to actually build that muscle.
The metrics worth tracking
An ad platform dashboard can show you 40 metrics. You don't need 40. You need maybe 8, and you need to know what each one is telling you.
Think of it like a car dashboard. Speed, fuel, engine temp — those matter. The clock in the corner is nice to know. Cabin humidity isn't relevant to whether you make it to your destination.
The metrics break into groups that roughly follow the customer journey — awareness, engagement, conversion, and profitability.
Awareness
Top-of-funnel. These tell you how many people saw your ad. They don't tell you if the ad worked.
- Impressions: How many times the ad was shown. Not how many people, not how many clicks — just total loads.
- Reach: How many unique people saw the ad. If reach is 1,000 and impressions are 3,000, the average viewer saw the ad three times.
Useful for brand campaigns. Not useful for measuring whether the ad did anything.
Engagement
Middle-of-funnel. Did people do something after seeing the ad?
- Click-Through Rate (CTR): Clicks ÷ impressions × 100. What percent of viewers clicked. A strong CTR usually means the ad's creative and targeting are working together.
- Engagement rate: A broader number that includes likes, comments, shares, and video views. More relevant on social where a click isn't the only action that matters.
A good CTR with a bad conversion rate is usually a creative-to-landing-page mismatch. Keep that in mind when diagnosing campaigns.
Conversion and profitability
Bottom-of-funnel. Did the ad make you money?
The point of most advertising isn't to get seen. It's to drive action. Conversion metrics are the actual verdict.
Metrics at a glance
| Metric Category | Key Metrics | What It Measures |
|---|---|---|
| Awareness | Impressions, Reach, Frequency | How many people are seeing your ads and how often. Essential for brand-building campaigns. |
| Engagement | Click-Through Rate (CTR), Engagement Rate | How compelling your ad creative and messaging are. Shows if you're capturing audience interest. |
| Conversion | Conversion Rate, Cost Per Acquisition (CPA) | How effectively your ads turn clicks into customers. Directly measures campaign efficiency. |
| Profitability | Return on Ad Spend (ROAS), Customer Lifetime Value (LTV) | The financial return on your investment. The ultimate test of whether your advertising is profitable. |
| Platform-Specific | View-Through Conversions (VTC), Cost Per Mille (CPM) | Nuanced metrics that reveal ad impact beyond a direct click, like on video or display networks. |
The three that actually decide whether a campaign is working:
- Conversion rate: What percent of clickers did the thing you wanted (purchase, signup, form fill). A high CTR with a low conversion rate almost always points at a broken landing page.
- Cost Per Acquisition (CPA): Total ad spend divided by the number of conversions. What one customer costs you.
- Return on Ad Spend (ROAS): Revenue ÷ spend. A ROAS of 4:1 means $4 in revenue for every $1 spent.
ROAS is the one you live and die by. Anything that doesn't map back to it eventually is a vanity metric. For more on picking the right ones, this piece on metrics that matter and how AI can surface them has some good framing.
Customer lifetime value (LTV)
One trap with ROAS: if you optimize only for immediate return, you under-invest in customers who stick around. A $100 CPA for a $50 first purchase looks insane — unless you know the typical customer spends $600 over two years. Then it's a good trade.
LTV is how much revenue you expect from a single customer over the whole relationship. When you pair LTV with CPA, you can acquire customers at what looks like a loss on day one, and it's actually a great investment. The teams that understand this usually outcompete the teams that don't.
Attribution — figuring out what gets credit
Customers almost never see one ad and buy. They see a social ad, Google the product a week later, read a review, then click a retargeting banner and buy. Six touchpoints, one sale. Which one gets credit?
That's the attribution problem.
Think of a soccer goal. The striker who kicks it in gets 100% of the credit, right? What about the midfielder who passed it? The defender who started the play? Attribution models are how marketers divide credit across all the touchpoints that led to a conversion. It's a core part of analytics in advertising, and it's how you turn a messy customer journey into something useful.
This guide to attribution modeling is a good deep-dive if you want to go further.
Single-touch models
The simplest attribution models give all the credit to one touchpoint. Easy to set up, easy to understand, usually wrong.
- First-touch: The first interaction gets 100% of the credit. Useful for understanding which channels create awareness. Ignores everything that happened after.
- Last-touch: The final touchpoint gets 100% of the credit. This is the default in most platforms, and it over-credits channels like branded search that just close out an existing intent.
Both give you a single frame of the movie. Sometimes that's enough. Usually it isn't.
Multi-touch models
Multi-touch attribution spreads credit across multiple touchpoints. More realistic, more complicated, more informative.
Attribution isn't about finding one magic channel. It's about figuring out how the channels work together.
- Linear: Splits credit equally across every touchpoint. If there were four touchpoints, each gets 25%. Fair but treats all touches as equally important, which isn't usually true.
- Time-decay: Touchpoints closer to the conversion get more credit. Works well for shorter sales cycles where recent interactions matter most.
- Position-based (U-shaped): First and last touch each get 40%. The middle touches split the remaining 20%. Recognizes that the channels that opened and closed the relationship probably mattered more than the ones in between.
Pick the model that matches how your customers actually buy. A B2B sale with a 90-day cycle needs a different model than an ecommerce purchase.
The marketing analytics market is projected to grow from $6.2 billion in 2025 to $11.5 billion by 2029, partly because teams need smarter attribution as third-party tracking dies. For more on that, check out our guide on the shift away from third-party data.
Building the data infrastructure
Good analytics doesn't happen without infrastructure. Campaign data, CRM data, product data, web data — they all live in different systems, and you need to pull them together before you can do anything useful with them.
Think of it in four stages: collection, integration, storage, presentation. Skip a stage and you end up with a pile of disconnected data and no real answers.
Collection
Your data sources are the ad platforms, the CRM, the web analytics, the product analytics. Specifically:
- Ad platforms: Google Ads, Meta Ads, LinkedIn Ads. Impressions, clicks, cost, platform-reported conversions.
- CRM: Salesforce, HubSpot. Lead status, deal size, LTV.
- Web analytics: What people do on your site. Our guide to tracking visits covers this in more detail.
- Product analytics: Mixpanel, Amplitude. User engagement, feature adoption, churn.
Each source is a partial view. The value comes from putting them together.
Integration and storage
Raw data from five systems is a mess. It has inconsistent formats, duplicate records, mismatched identifiers. Before it's useful, it needs to be cleaned and unified. That's what ETL (Extract, Transform, Load) tools do.
The cleaned data lands in a data warehouse — BigQuery, Redshift, Snowflake. This is your single source of truth. Every team queries the same numbers, so you stop arguing about whose spreadsheet is right and start arguing about what the numbers mean.
The warehouse ends the "whose data is right" debates. Every team runs against the same unified dataset, which is what makes real analysis possible.
Having all the data in one place is what lets you actually run attribution models and get consistent answers. The infographic below shows how attribution assigns credit across touchpoints once you have the data unified:
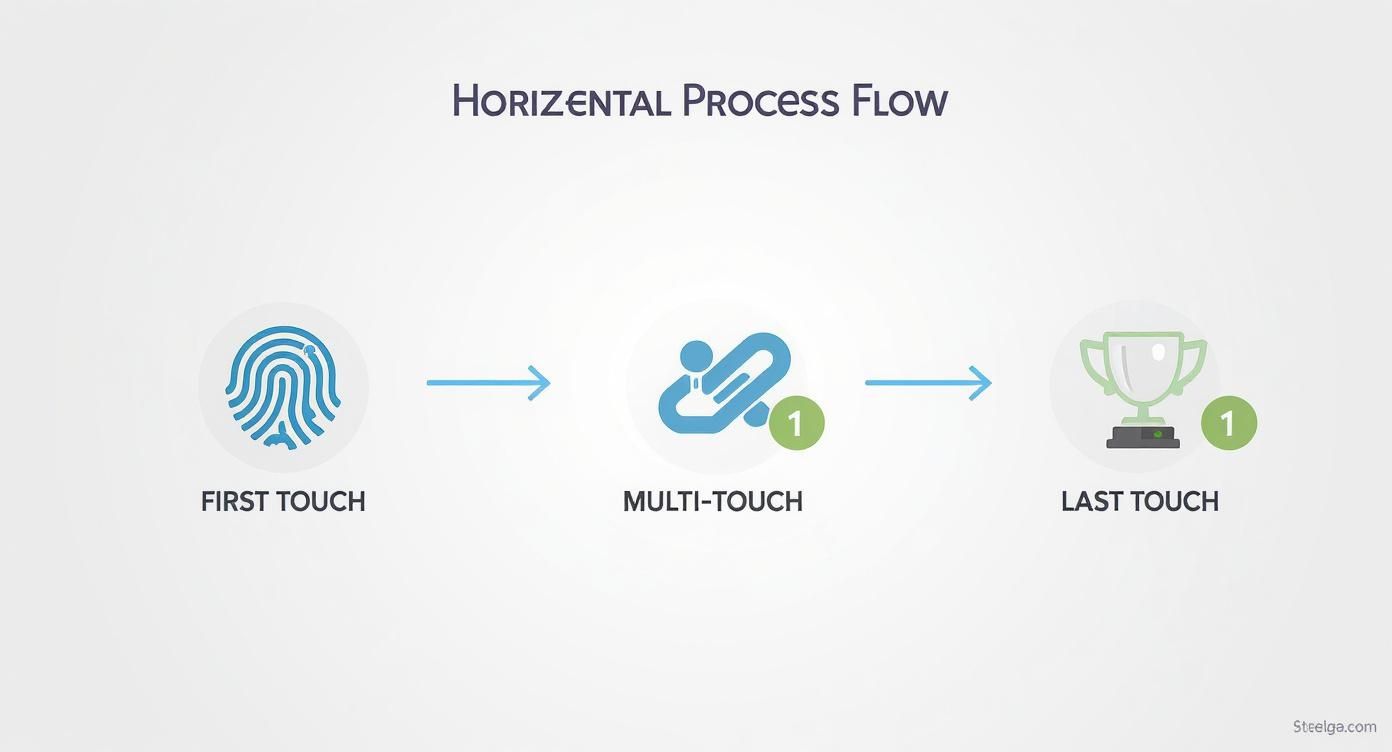
This matters because you can't run this kind of analysis with data scattered across five dashboards.
Presentation
The last stage is visualization — tools like Tableau, Looker, or Google Data Studio. They connect to the warehouse and turn rows of numbers into charts and dashboards anyone on the team can read.
The goal here is to make the data legible to people who don't want to write SQL. A good dashboard answers specific business questions without requiring a data scientist to interpret it.
Going beyond clicks into creative

CPA and ROAS tell you if a campaign made money. They don't tell you why. The next layer of analytics is about understanding which creative choices actually work — so you can do more of what works and less of what doesn't.
Real question: is the lifestyle photo outperforming the product shot? Is the direct headline beating the clever one? Is the 15-second video better than the 30-second one? These are answerable with the right tagging and a little discipline.
The digital ad market is expected to hit $843 billion in 2025, with mobile accounting for about 70% of total spend by 2028. As costs go up, knowing which creative choices actually drive returns stops being optional. You can see the numbers in more detail here.
Tagging your creative
You can't analyze what you haven't categorized. Start by tagging every ad against a small set of attributes:
- Visual style: Product-focused, lifestyle, UGC, animation
- Copy tone: Inspirational, urgent, humorous, educational
- Video length: Under 15s, 15–30s, over 30s
- CTA: The exact text — "Shop Now," "Learn More," "Get a Free Demo"
Once this is tagged, your performance reports get a lot more useful. You might find that for B2B audiences, educational copy with product-focused visuals drives the lowest CPA. For consumer, it might be lifestyle imagery with urgent copy. Those patterns are actionable. A report that just shows CPA by campaign isn't.
Brand metrics
Performance data tells you what people did. Brand data tells you how they felt about it. Both matter for long-term health.
Counting clicks isn't enough. You need to understand the signals your audience sends about what they trust and what they respond to.
A couple of brand metrics worth tracking:
- Brand sentiment analysis: Monitor whether mentions of your brand trend positive, negative, or neutral. A campaign can have a great CPA and still damage the brand if it's generating backlash.
- Share of Voice (SOV): Your brand's visibility relative to competitors. A strong campaign should drive both conversions and market presence.
Combining these with your quantitative performance data gives you a more complete picture. If you want to go deeper on enriching your CRM with brand data, our guide on B2B data enrichment strategies covers the practical side.
Testing
The way you get definitive answers about creative is structured A/B testing. Change one variable at a time — the headline, the image, the CTA — and run two versions against the same audience.
Test big ideas before small ones. New value prop, new visual style, new positioning — these are worth testing. Button color changes? Usually not. Start with changes that could move the needle.
Actually using the data
Collecting data is the easy part. Acting on it is where most teams stall. A campaign dashboard full of insights that nobody acted on is worthless.
Here's what separates teams that actually use their data from teams that just collect it.
One source of truth
The fastest way to kill a data-driven culture is to let every team keep their own spreadsheet. When marketing's numbers don't match sales's CRM, you spend more time reconciling than acting.
The data warehouse should be the single source of truth. Every team queries it. Every dashboard pulls from it. When a number shows up in a meeting, everyone knows where it came from. That's the foundation everything else sits on.
Define what "win" means before you launch
Never launch a campaign without knowing what would make it a success. Is the goal direct sales (ROAS), qualified leads (CPA), or brand awareness (reach and engagement)?
This does two things:
- Keeps the team focused. Creative, targeting, budget — all get decided against a known goal.
- Makes reporting easy. You can see at a glance if the campaign is working, instead of scrolling through 20 metrics trying to tell a story.
Test continuously
The teams that consistently win treat testing as a habit, not a project. Every campaign has a hypothesis. Every hypothesis gets tested.
Data doesn't give you answers. It gives you better questions. The teams that ask them get better over time.
A working loop: "We think a testimonial video will lower CPA below our current static ad." Run the test. Measure against the KPI. If the testimonial wins, roll it out. If it doesn't, the hypothesis was wrong — next test.
A real example
A B2B SaaS company was running LinkedIn ads for demo requests. CPA was too high. CTR was fine; the problem was on the landing page side — clicks weren't converting.
Instead of just adjusting bids, they dug into creative analytics. Their ads with product dashboard screenshots had a 15% higher CTR than ads with generic lifestyle photos. But the landing page those ads pointed to didn't show the dashboard — it showed a stock photo of a meeting.
They rebuilt the landing page around the dashboard screenshot, matching what the ad had shown. The conversion rate on that page jumped over 30%, and the CPA dropped into their target range.
The fix wasn't more budget or new targeting. It was consistency between the ad and the landing page — and they found it because they had the creative tagged.
Questions that come up
How can small businesses start with ad analytics?
You don't need an expensive stack. The free tools are enough to start.
Use the built-in analytics in Google Ads and Meta Ads — they give you clicks, cost, conversions out of the box. Set up Google Analytics on your site so you can see what happens after the click.
Pick one goal to track. Online sales. Lead form signups. Whatever matters most. Use that to calculate ROAS. Once you have a handle on that, you can layer in more sophisticated tools.
What's the difference between ad analytics and web analytics?
Think of a party. Ad analytics is about the invitations. Web analytics is about what happens once people show up.
- Ad analytics tracks impressions, clicks, CPC. It tells you if your ads got people to your site.
- Web analytics tracks what those visitors do on your site — which pages they visit, how long they stay, whether they convert. It tells you if your site is doing its job.
You need both. Ad analytics without web analytics gets you traffic with no idea what happened to it. Web analytics without ad analytics tells you what visitors do but not where they came from.
How do I prepare for a cookieless future?
Third-party cookies dying isn't a technical problem — it's a strategic one. You have to move from tracking anonymous users across the web to building direct relationships with yours.
The cookieless future isn't about finding new ways to spy on people. It's about using the data customers give you directly, and finding privacy-safe ways to measure what works.
Three priorities:
- Invest in first-party data. Email signups, customer accounts, gated content. It's more accurate and it's yours.
- Set up server-side tracking. Conversion APIs from Meta and Google send data server-to-server, which is more reliable than browser cookies.
- Look into clean rooms and other privacy-safe measurement. They let you analyze aggregated data without exposing individuals. Getting familiar with these now will save you time later.
Building personalized ad experiences that need real-time brand data? Context.dev gives you an API to pull logos, colors, and company profiles instantly. Get a free API key.